You cannot improve what you do not measure. In Salesforce, measuring data quality means turning a vague sense that “the data is messy” into a number you can track, a breakdown you can act on, and a trend you can watch. That number is a Data Quality Score — sometimes called a data reliability score — and this guide explains how it works, how to read it, and how to act on it.
What a Data Quality Score Is
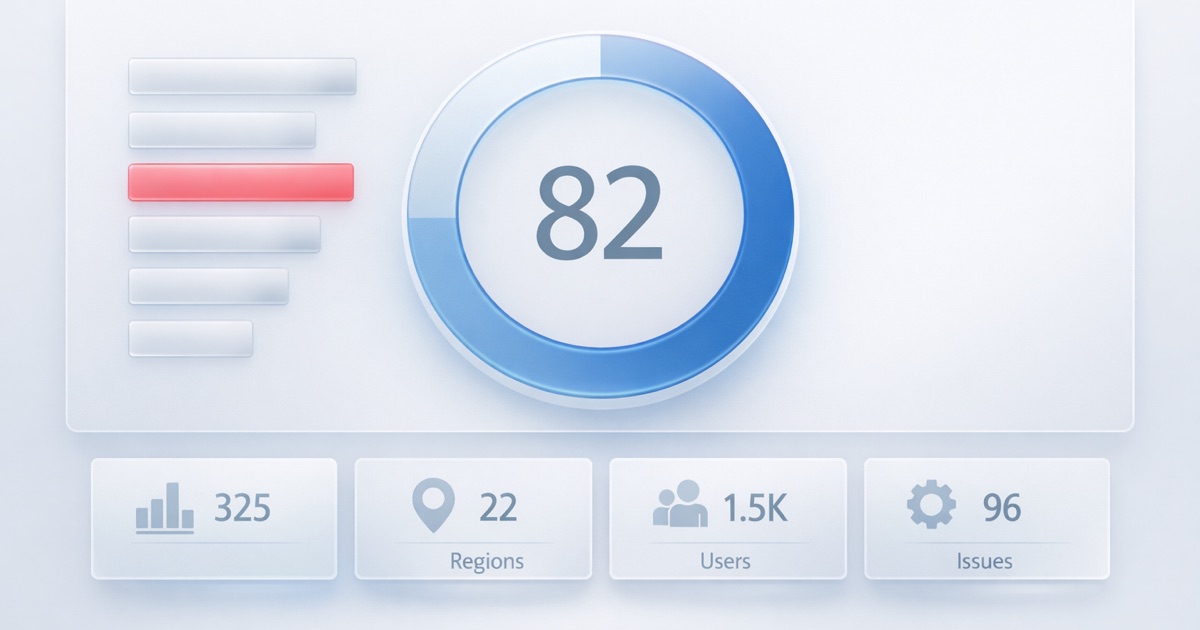
A Data Quality Score is a single figure, on a 0–100 scale, that summarizes how well a set of Salesforce records meets the quality rules you define. A score of 100 means the included dimensions received full marks under the configured rules. It does not prove that unscanned fields are correct or that an AI deployment is ready. Read the scope and field-level results alongside the headline score.
The score is not a vanity metric. Its value comes from three properties:
- It is composite. The score rolls up multiple data quality dimensions — completeness, validity, uniqueness, consistency, timeliness — into one comparable number.
- It is weighted. Not every problem matters equally, so the score reflects business priority rather than raw issue counts.
- It is repeatable. Run on a schedule, the same calculation turns a one-time audit into a trend line you can manage.
“Data reliability score” and “data quality score” describe the same idea: a quantified, trustworthy measure of whether your data is fit for use.
Measure Field Completeness in Salesforce
Start with one object and an explicit population. For example, count the Accounts created this year, then count how many have an Industry value. Keep the filter identical for every metric you compare.
SELECT COUNT(Id) totalAccounts, COUNT(Industry) withIndustry
FROM Account
WHERE CreatedDate = THIS_YEAR
Salesforce’s COUNT(fieldName) counts non-null values. If the query returns 1,000 Accounts and 820 populated Industry values, the field fill rate is 820 / 1,000 × 100 = 82%. These are illustrative numbers, not a customer result.
A populated field is not necessarily useful. A value such as “Unknown” may pass a non-null count but fail your completeness policy. A plausible email format does not prove the mailbox exists. Use the completeness checks and validity checks separately, and record which rules you used.
How the DQS Score Is Calculated
DQS combines the dimension scores produced by a scan using this formula:
Overall score = SUM(dimension score × dimension weight) / SUM(included weights)The result is rounded to two decimal places. Only dimensions with a non-null score enter the calculation. A dimension that was not scanned is excluded; a measured dimension with no data scores zero. Those cases are different and should be explained when reporting the result.
The following worked example uses the default weights documented for the five operational dimensions. AI and PII checks are not included in this example.
| Dimension | Example score | Weight | Score × weight |
|---|---|---|---|
| Completeness | 82 | 25 | 2,050 |
| Validity | 90 | 20 | 1,800 |
| Uniqueness | 96 | 15 | 1,440 |
| Timeliness | 70 | 15 | 1,050 |
| Consistency | 88 | 15 | 1,320 |
| Total | 90 | 7,660 |
7,660 / 90 = 85.11 out of 100. Weights do not have to add up to 100 because the denominator normalizes them. If you also scan AI content and PII, include their scores and weights in both sums; do not treat unscanned checks as perfect results.
Dimension scores come from the configured checks. Do not assume that a simple non-null field count reproduces every DQS dimension score. Inspect the field and metric results before interpreting the aggregate.
Keep a Measurement Record
For each baseline and follow-up scan, record:
- Object, selected fields, filters, and scanned record count.
- Enabled checks, thresholds, and weights.
- Scan timestamp and any configuration changes since the baseline.
- Overall score, weakest fields, and who owns the follow-up.
A score that improves after excluding problematic records does not demonstrate that those records were fixed. Compare the same population and configuration, or explain why they changed.
Why Weighting Matters
Two orgs can both score 80 and be in completely different shape. One has minor formatting issues spread across low-stakes fields. The other has 20% of its Opportunity Amounts missing. An unweighted count of failures would treat these the same.
Weighting fixes that. By choosing relevant fields and assigning higher weights to the dimensions that drive revenue, reporting, and automation, the score tracks business impact rather than issue volume. When you tune weights to your priorities, the number starts to mean something a leader can trust.
Reading the Score
A score is only useful if you can move from the headline number to a decision. Read it in three passes:
| Pass | Question | What you look at |
|---|---|---|
| 1. Headline | How healthy is this data overall? | The single weighted Data Quality Score |
| 2. By dimension | What kind of problem dominates? | Per-dimension scores (e.g. completeness vs. uniqueness) |
| 3. By field | Where exactly is the problem? | Field-level breakdown within the weakest dimension |
By the third pass you are no longer looking at “data quality” in the abstract. You are looking at a specific field, on a specific object, with a specific failure rate — which is a task someone can own.
From Score to Action
A score turns measurement into a prioritized to-do list:
- Baseline. Run the first scan to establish where you stand.
- Prioritize. Sort issues by business impact (weight) against effort to fix. The highest-weight, lowest-effort problems come first.
- Fix. Clean up existing records, add validation rules to stop new bad data, and adjust intake processes.
- Re-measure. Run the scan again and watch the score move. Improvement you cannot see is improvement you cannot defend.
Tracking Quality Over Time
A single measurement is obsolete the day after you take it, because Salesforce data degrades continuously. The point of a score is the trend, not the snapshot. Scheduled scans — daily, weekly, or monthly — turn the score into a line you can monitor, so a new integration that starts writing bad data shows up as a dip you catch in days, not a problem you discover months later in a broken report.
How DQS Measures It
Data Quality Sense produces a weighted Data Quality Score entirely inside Salesforce — no records are exported. You define what good looks like in the Definition Builder (select dimensions, scope objects and fields, set thresholds and weights), run the scan on demand or on a schedule, and explore the result in Insight Studio: the overall score, the per-dimension breakdown, field health, and the trend over time. Each result reflects the data examined during that scan. The next scheduled or manual scan measures subsequent changes; this is not an on-save validation service.
Next Steps
See the Salesforce data quality dashboard to turn these measurements into a recurring review. For product setup, follow the Definition Builder guide.
- Data Quality in Salesforce: the complete guide
- The Five Dimensions of Data Quality: what the score measures
- Measuring Data Quality: KPIs and scorecards in depth
- Agentforce Preparation: getting your score AI-ready